GEX — Gamma Exposure
See where dealers are forced to buy or sell
Options market makers hedge their books — and that hedging quietly shapes price action.
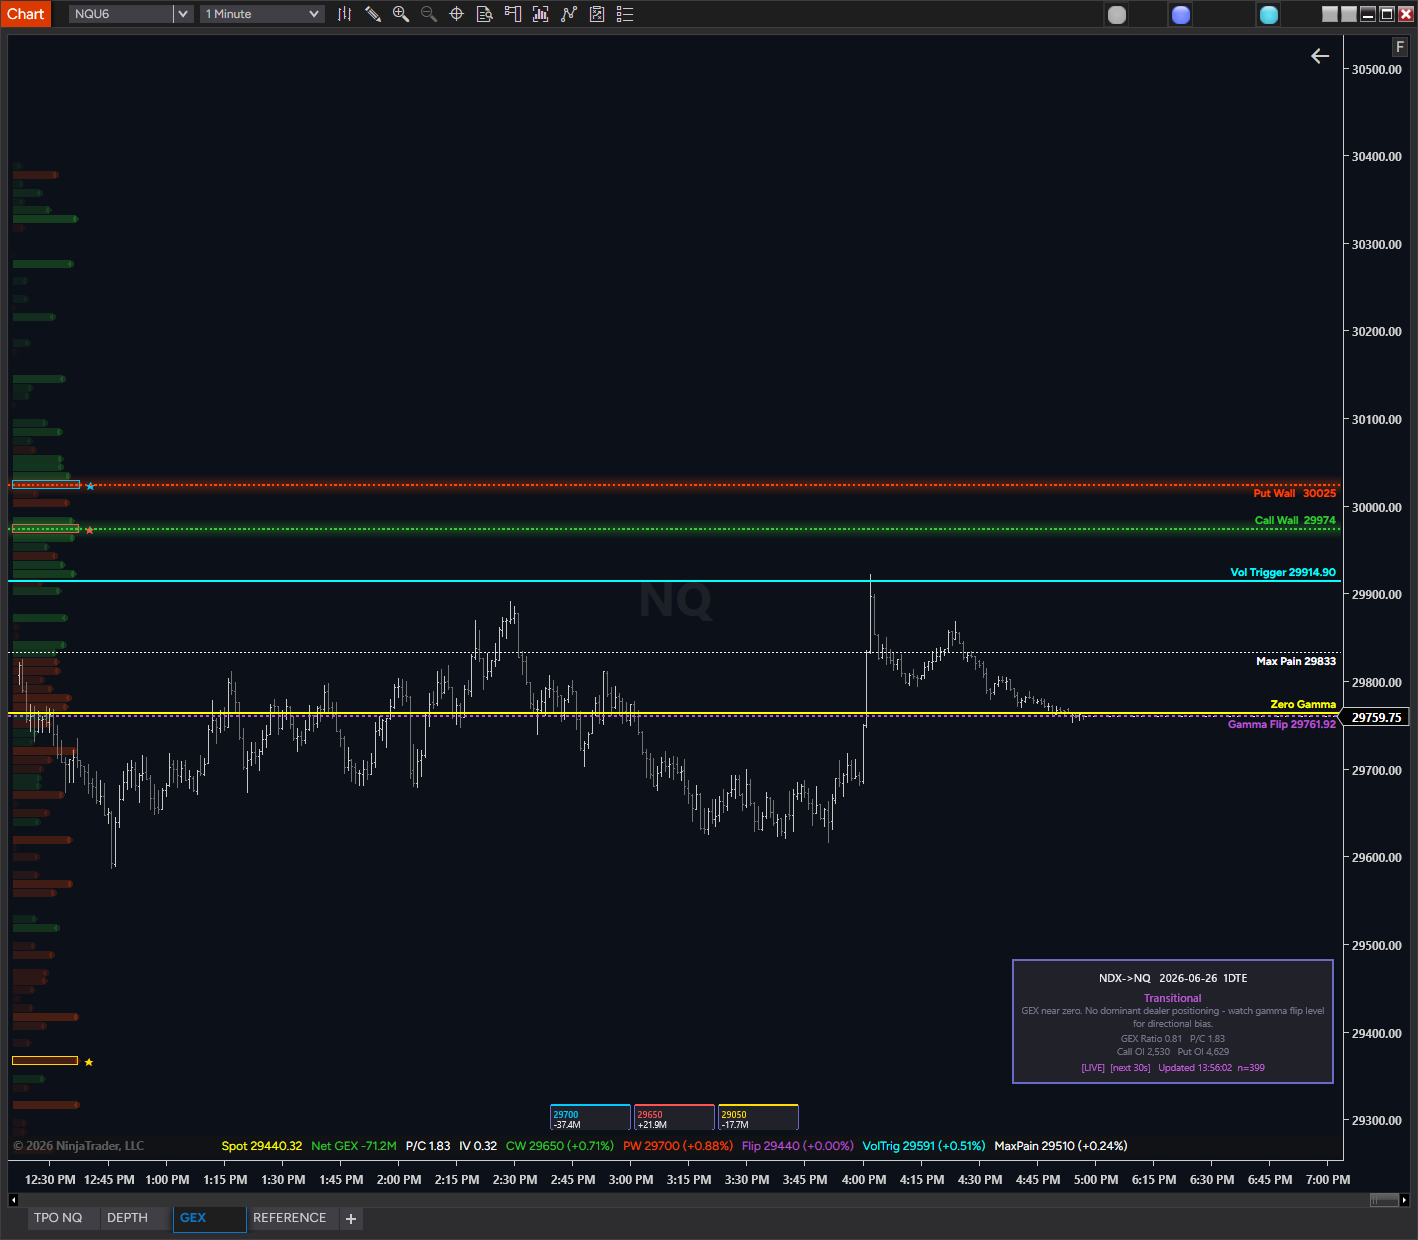
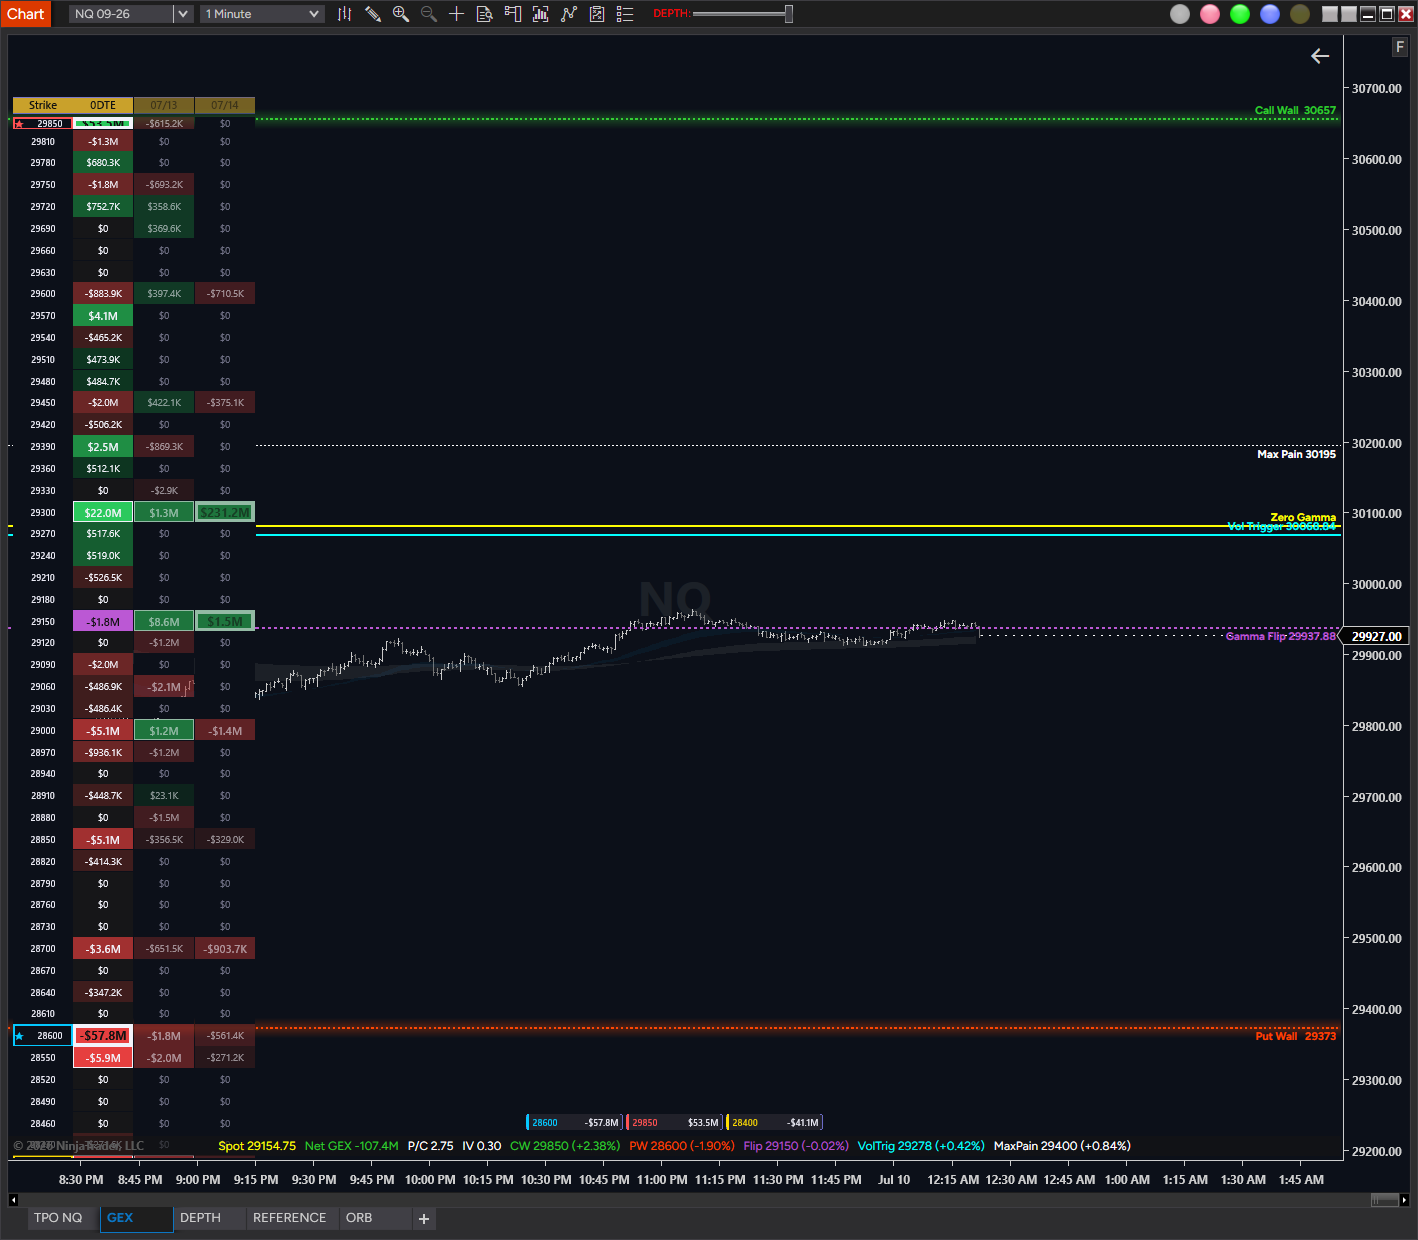
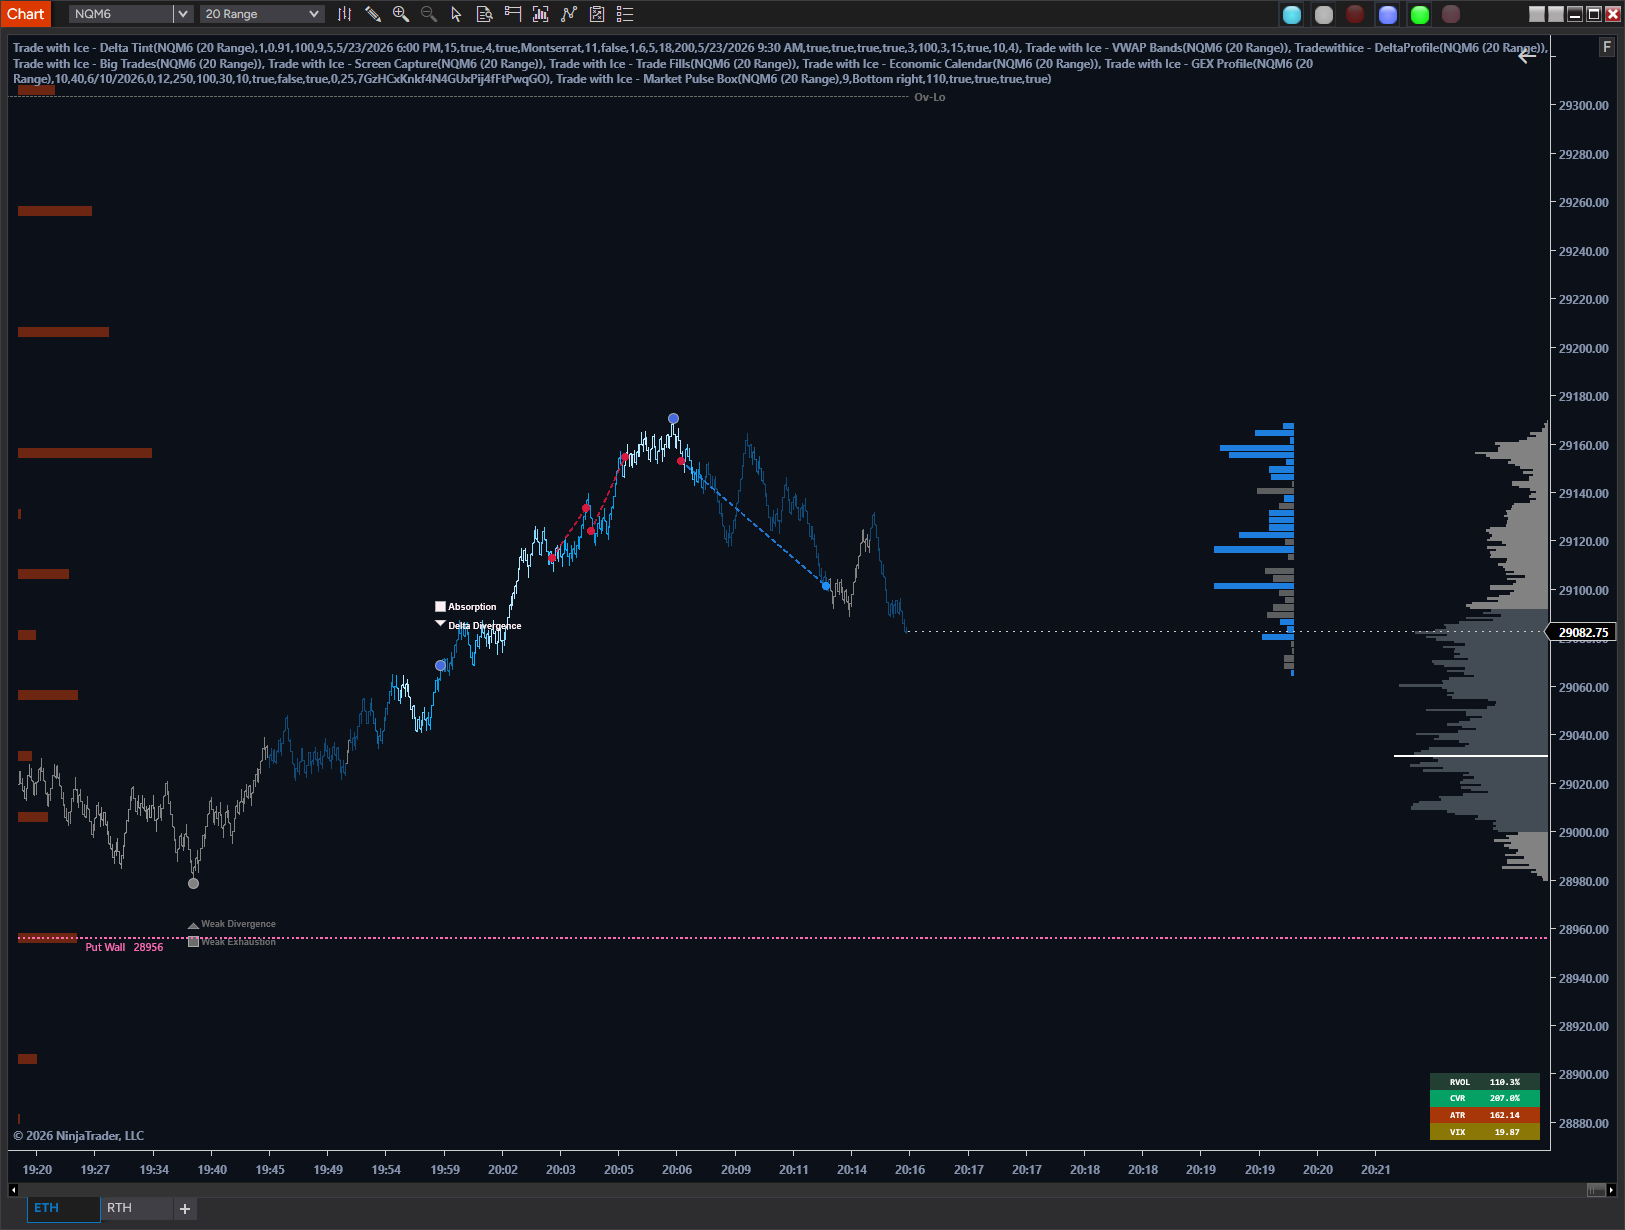
GEX plots live gamma exposure levels straight onto your futures chart: call walls, put
walls, and the gamma flip point. Above the flip, dealers tend to dampen moves and price
gets pinned. Below it, they amplify them and moves can run further and faster than usual.
Know which regime you're trading in before you take the trade.
146 liquid optionable tickers — index products, sector/commodity/bond ETFs, and mega-cap single
stocks. Index products (SPX, NDX, SPY, QQQ) have daily expirations. Everything else has weekly (Friday) +
monthly expirations.
IV note: index symbols anchor their IV level to the published vol index (VIX/VXN/GVZ, sanity-guarded); all other
tickers anchor to their realized volatility. The relative skew shape and per-strike call/put basis are preserved.
Stars mark the strikes whose gamma exposure is growing fastest since today's market
open — not just the biggest walls, but the ones building momentum right now. Each
star's color matches a ranked card in the summary strip, so you can tell at a glance
which is #1, #2, #3.
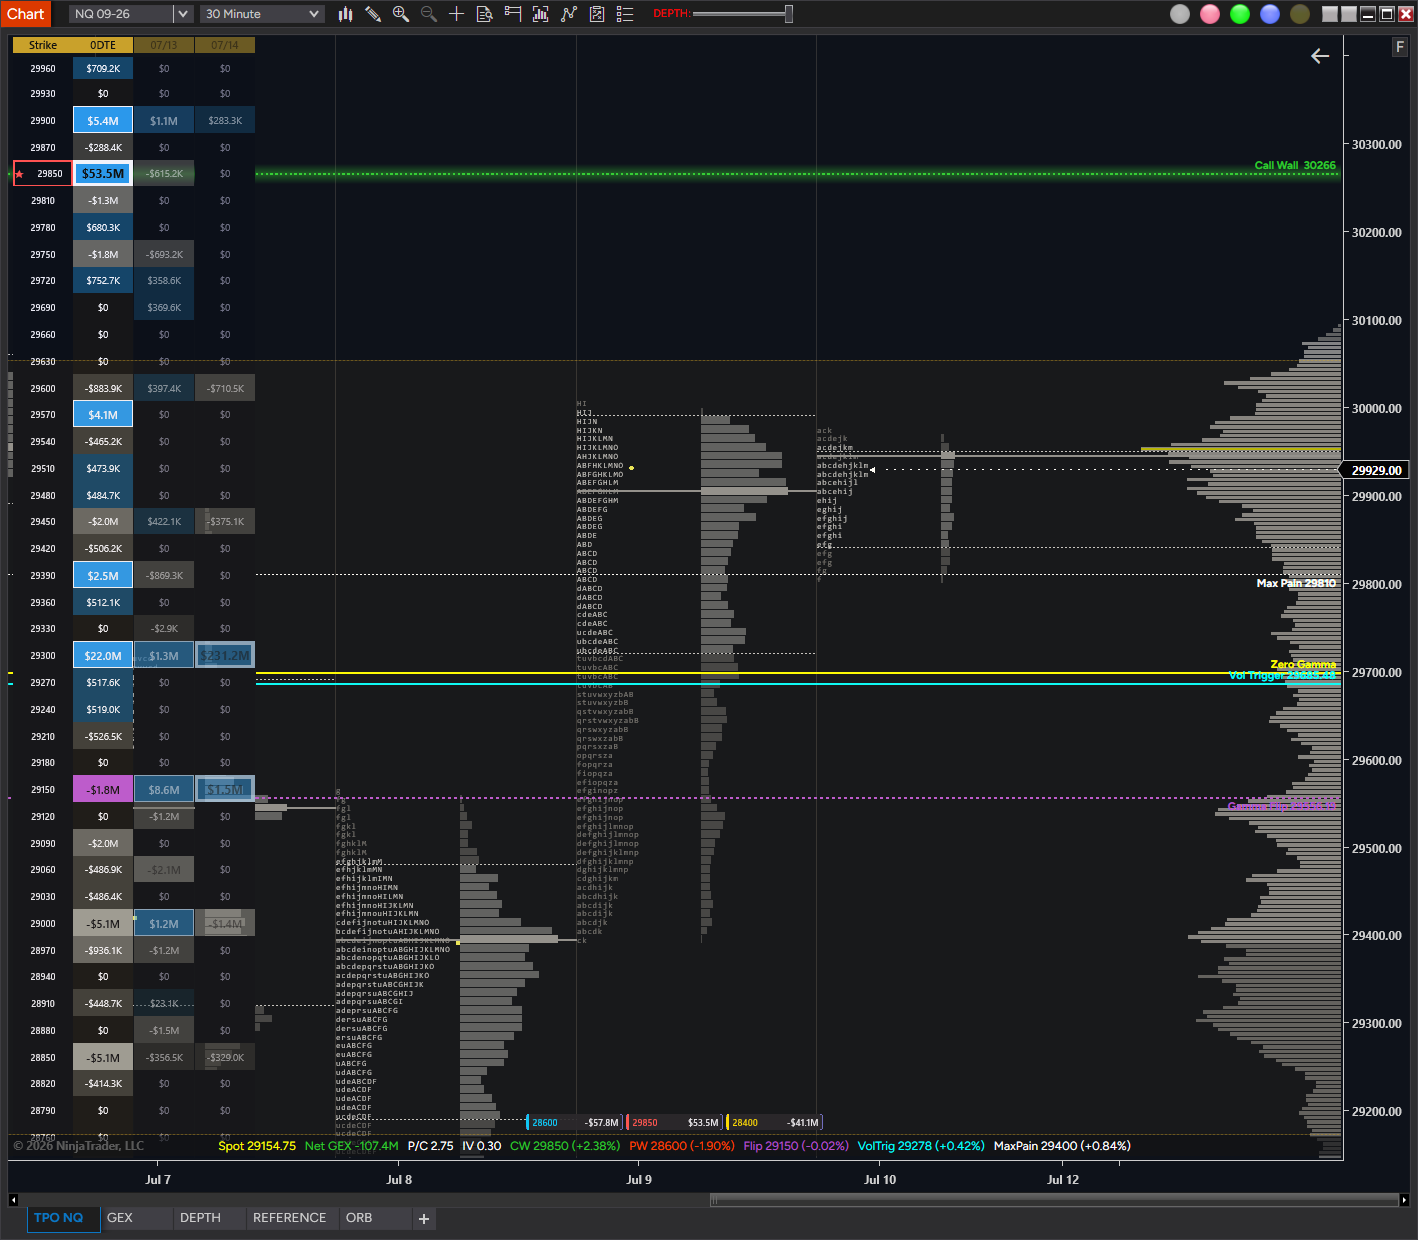
Live call wall & put wall levels plotted on your chart
Gamma flip line — know when dealers shift from dampening to amplifying moves
Zero gamma line for regime context
Auto-mapped from options strikes to your futures price scale
Star-ranked strikes show where gamma is building fastest, with a ranked summary strip
Fully customizable — colors, zone widths, and labels, your way
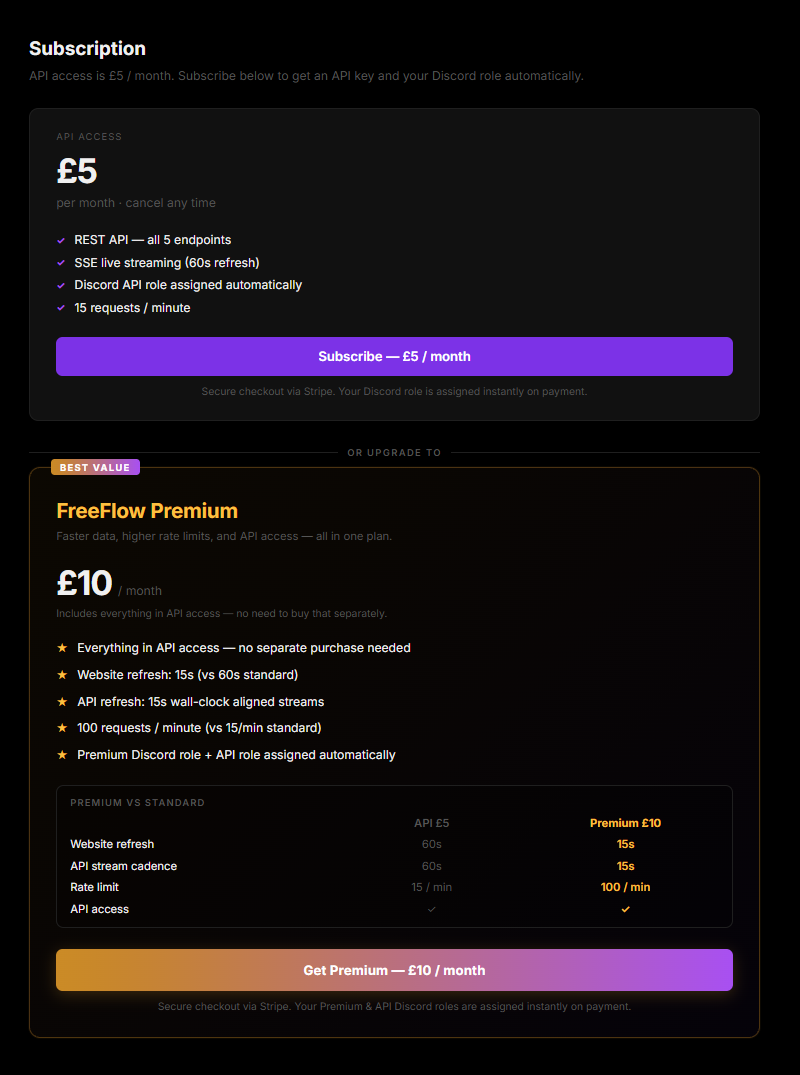
FreeFlow subscription needed for data
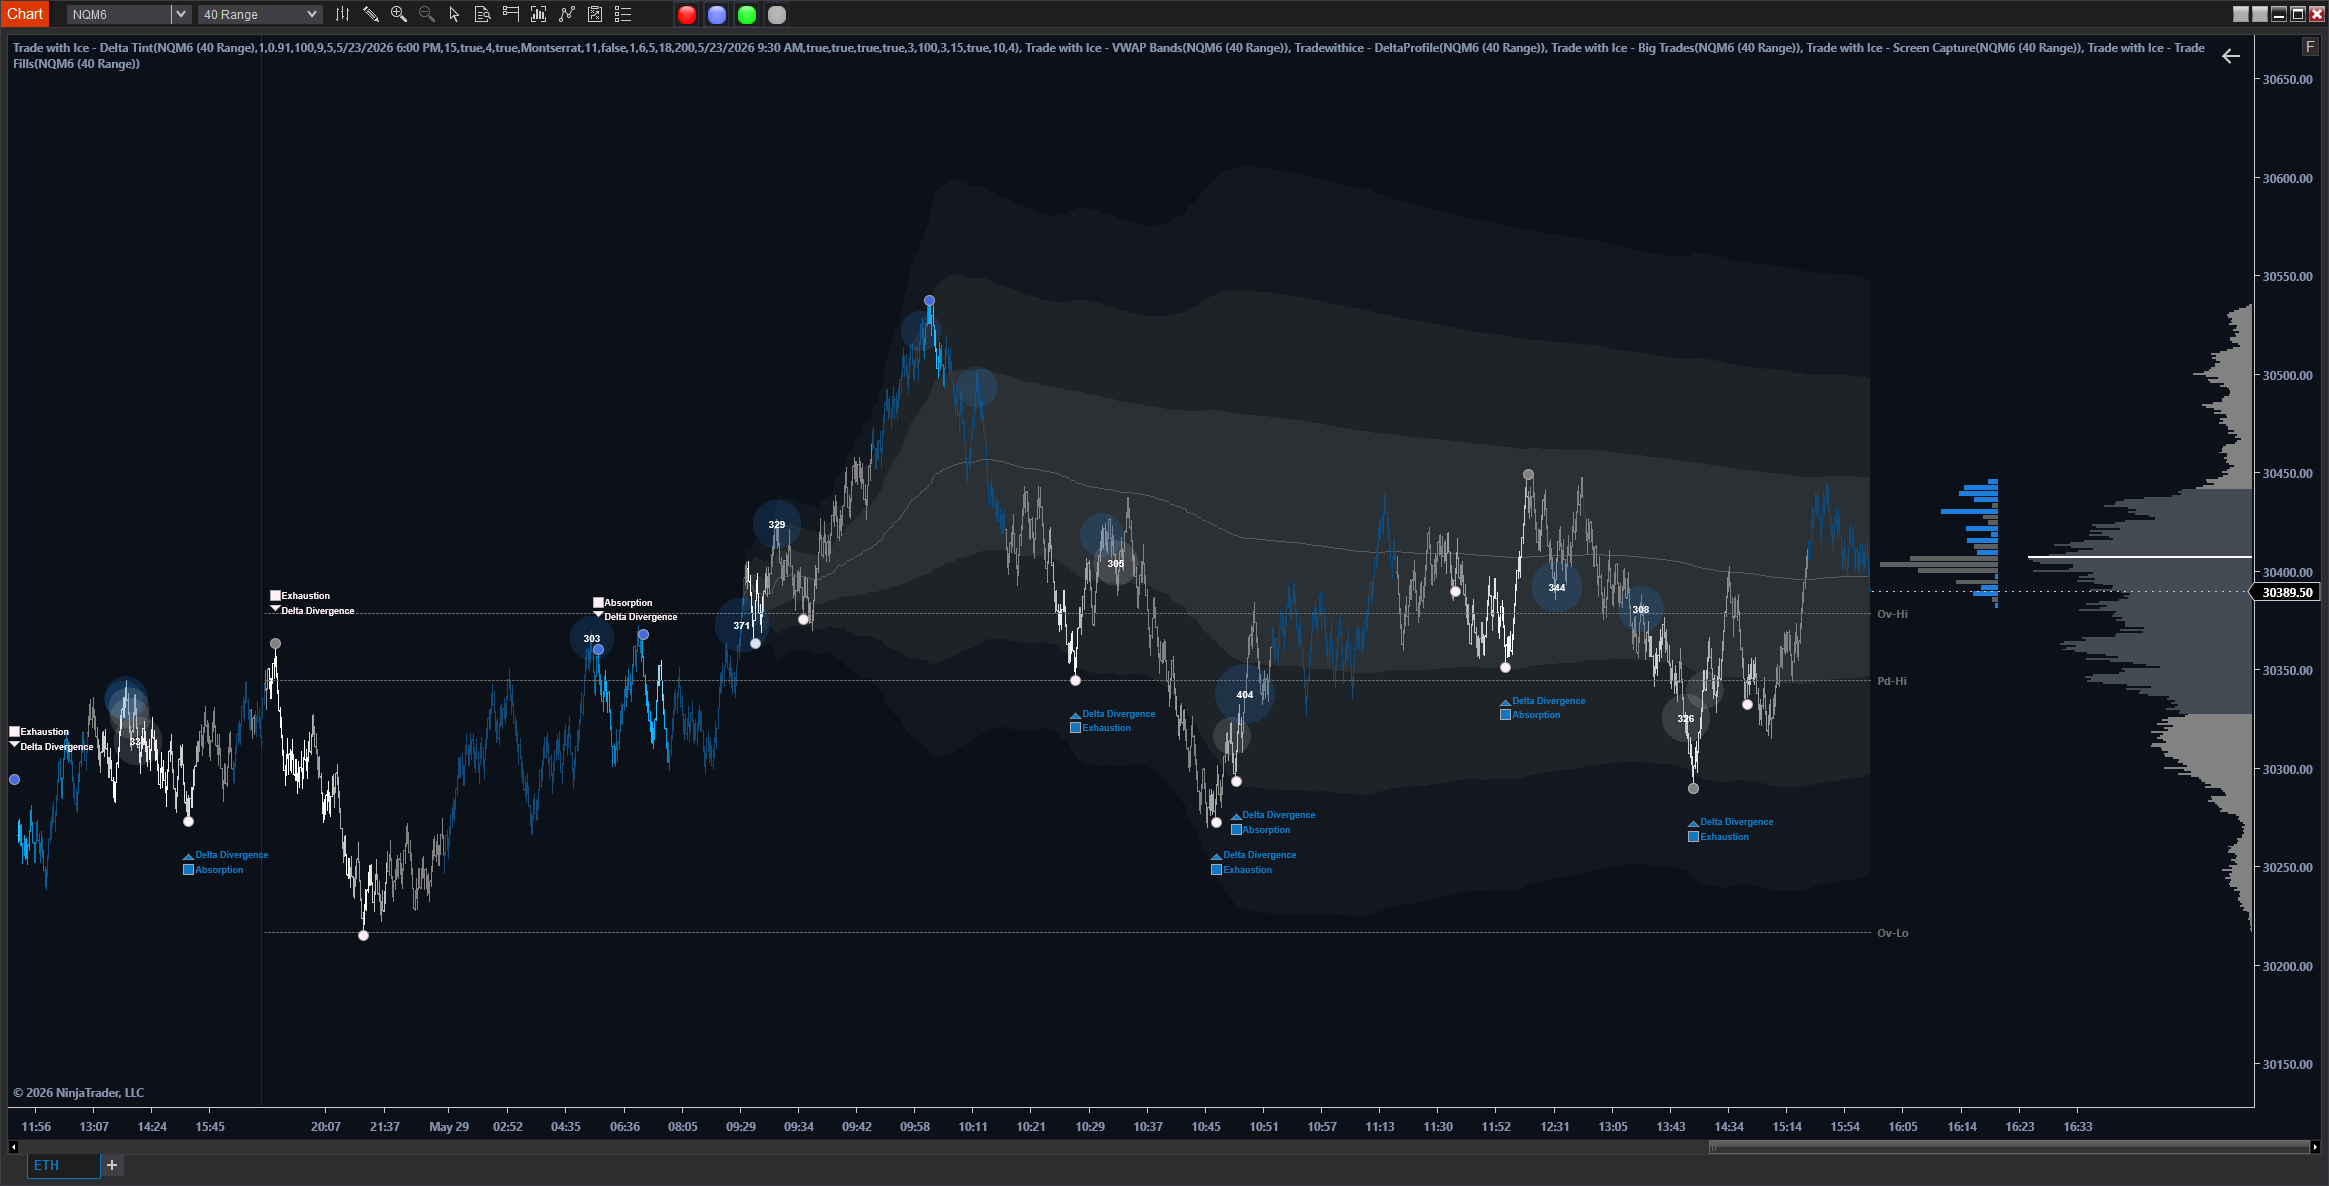
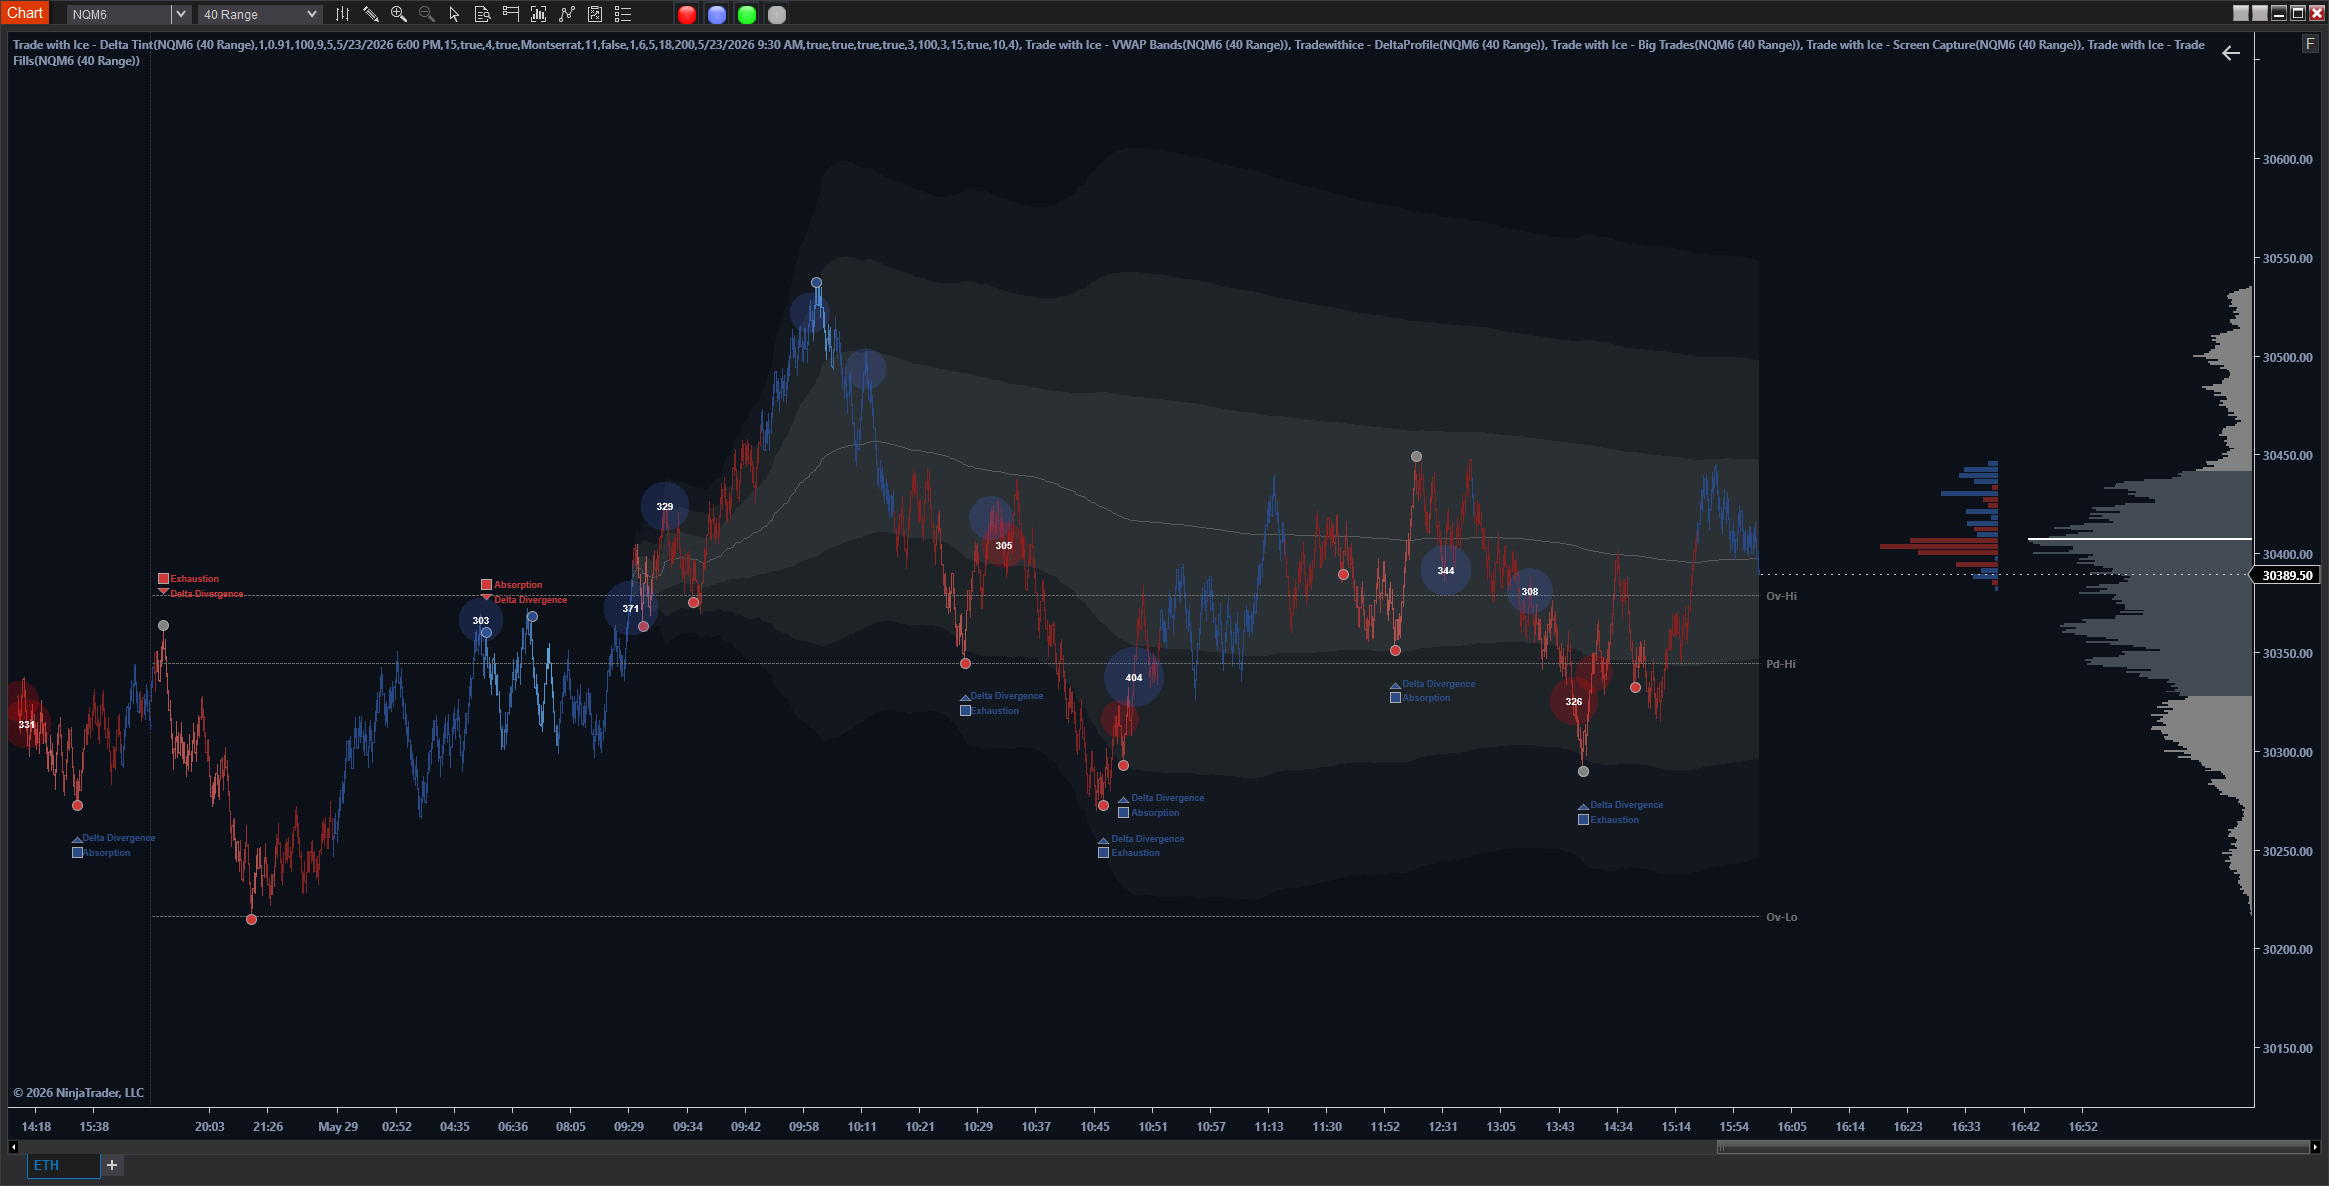
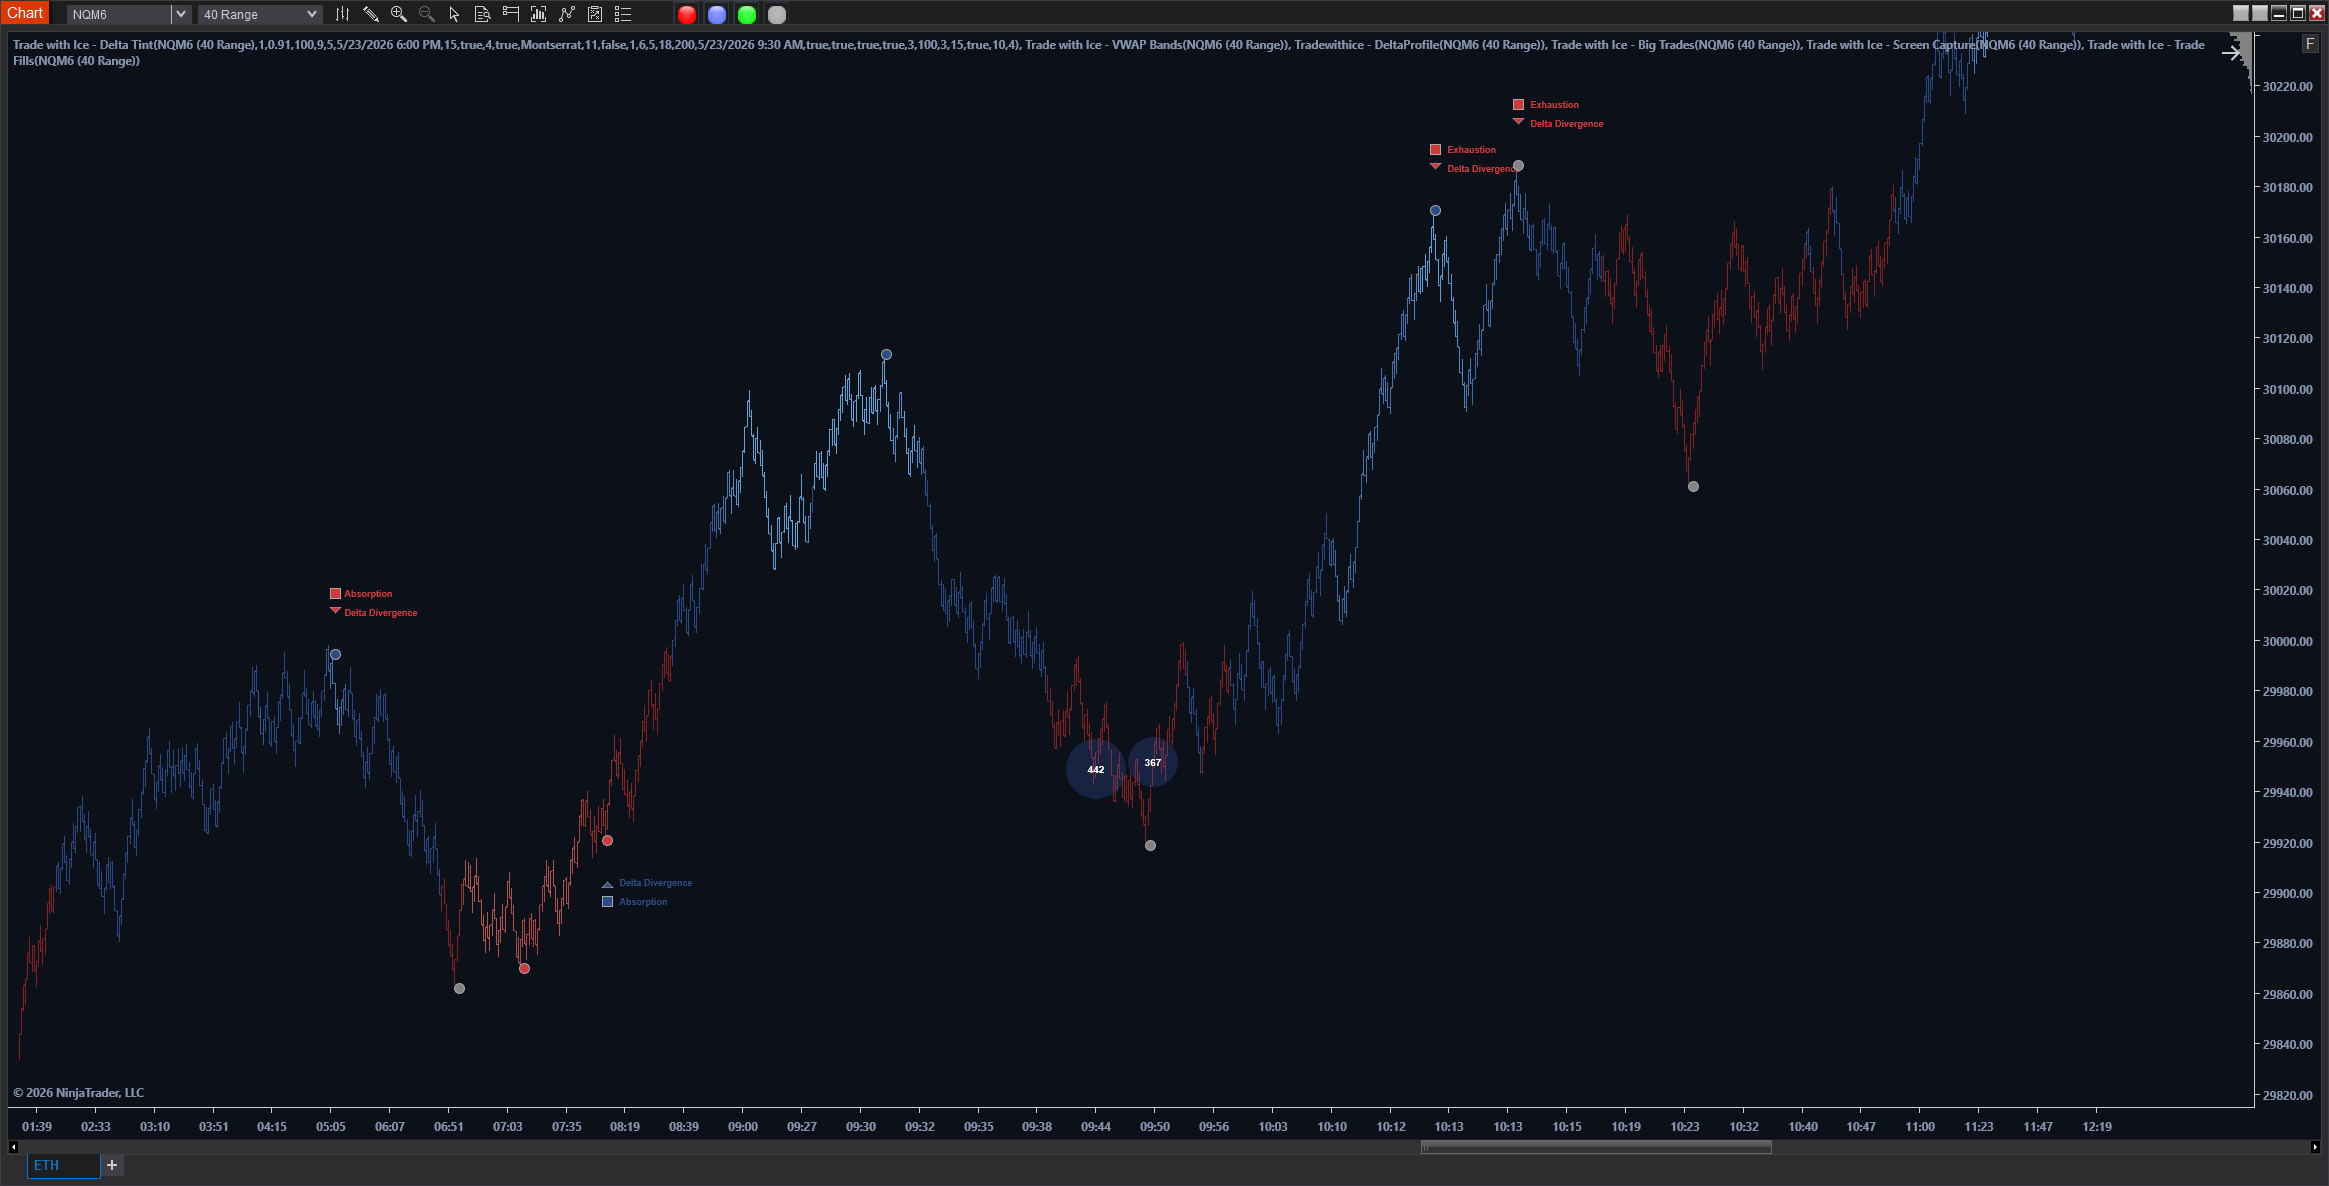
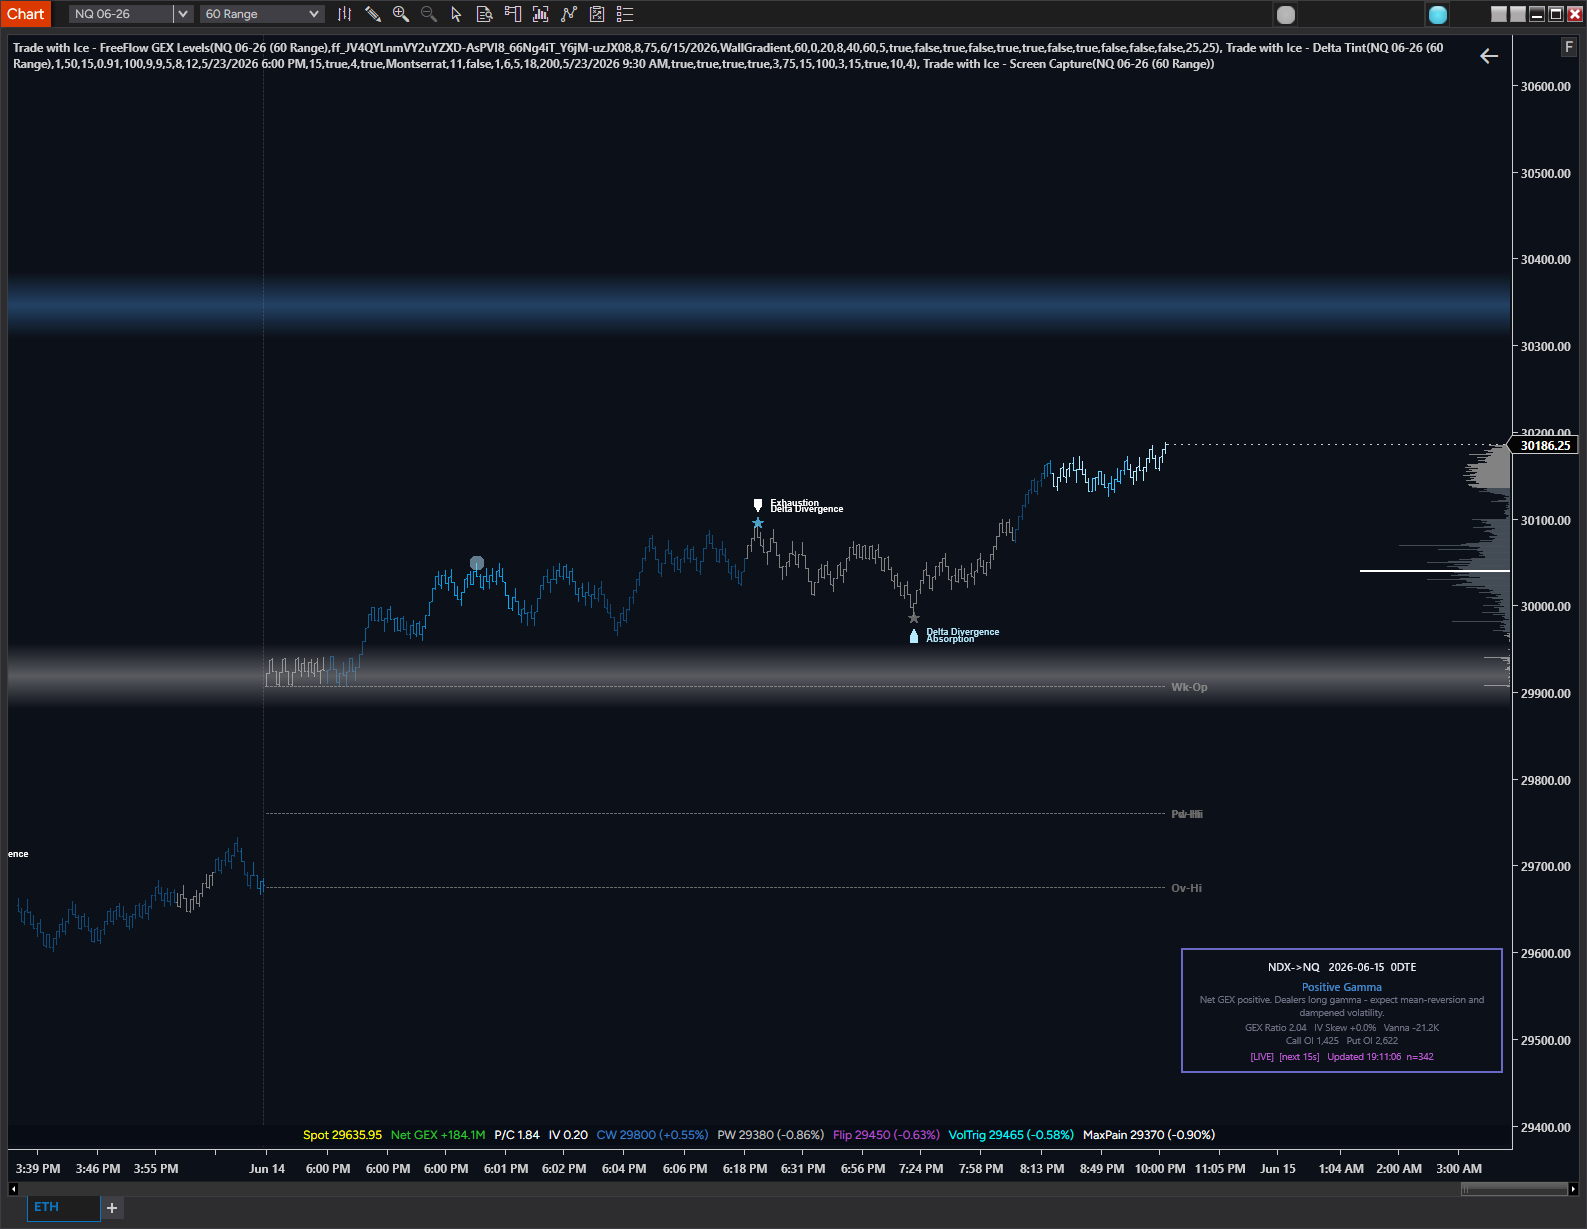
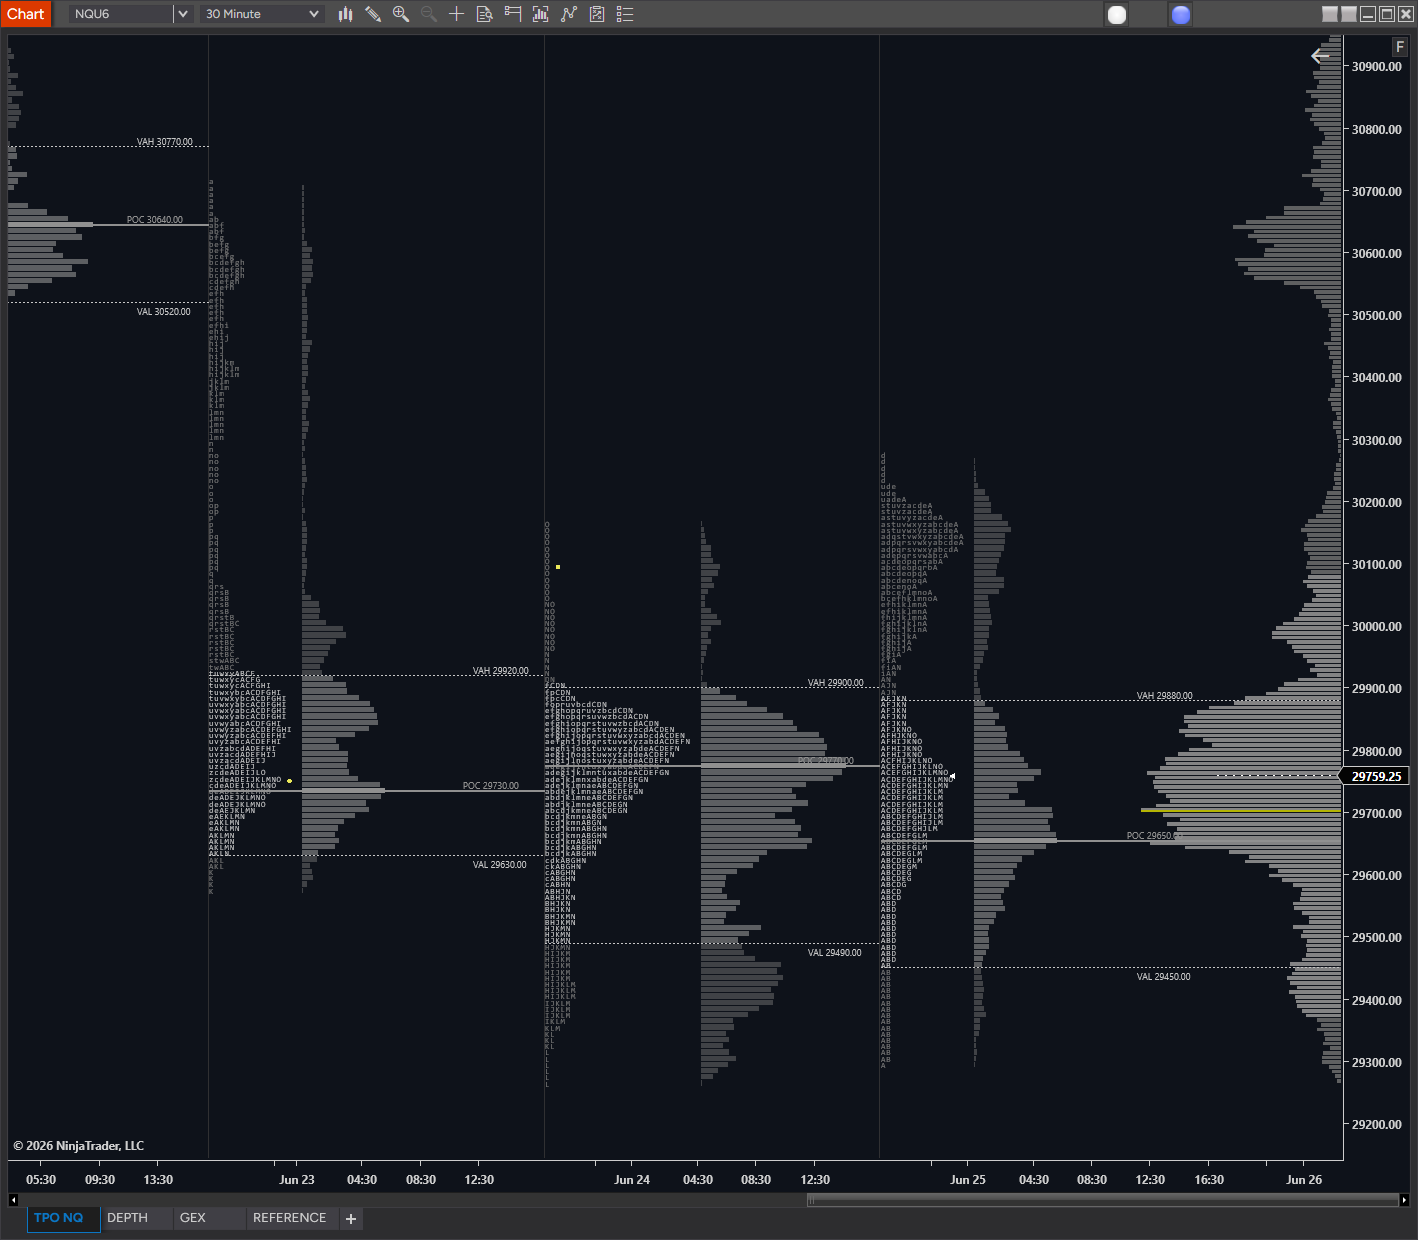
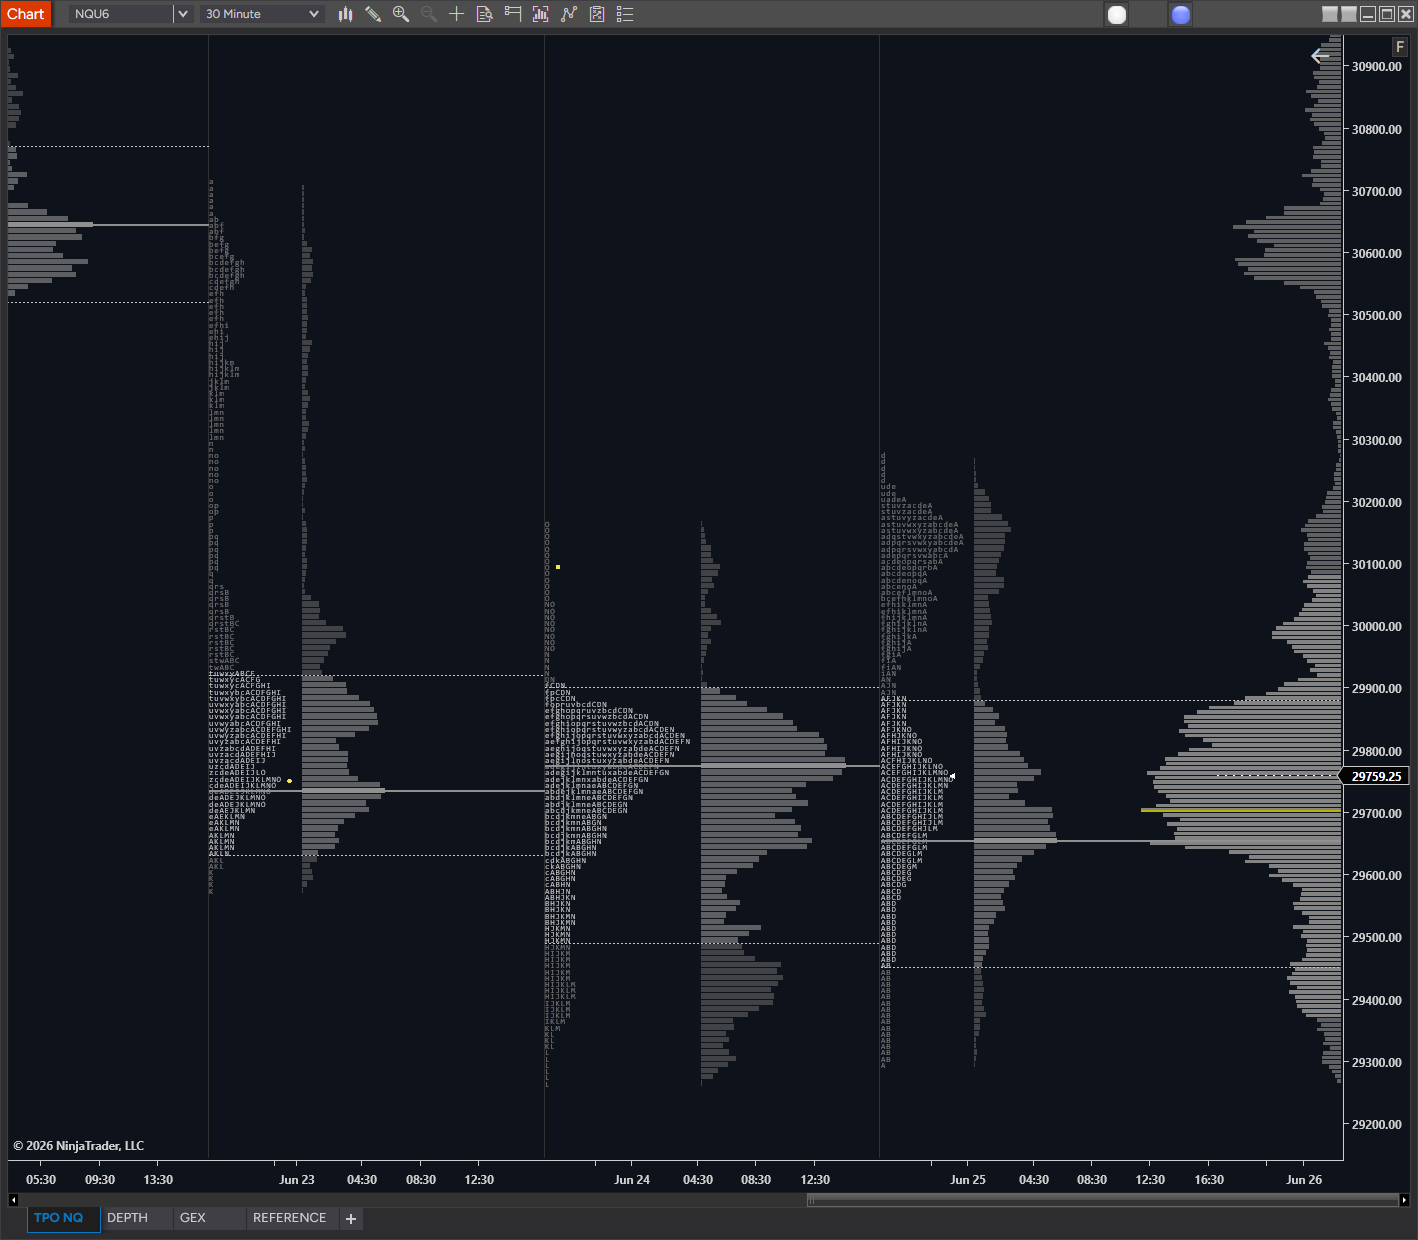
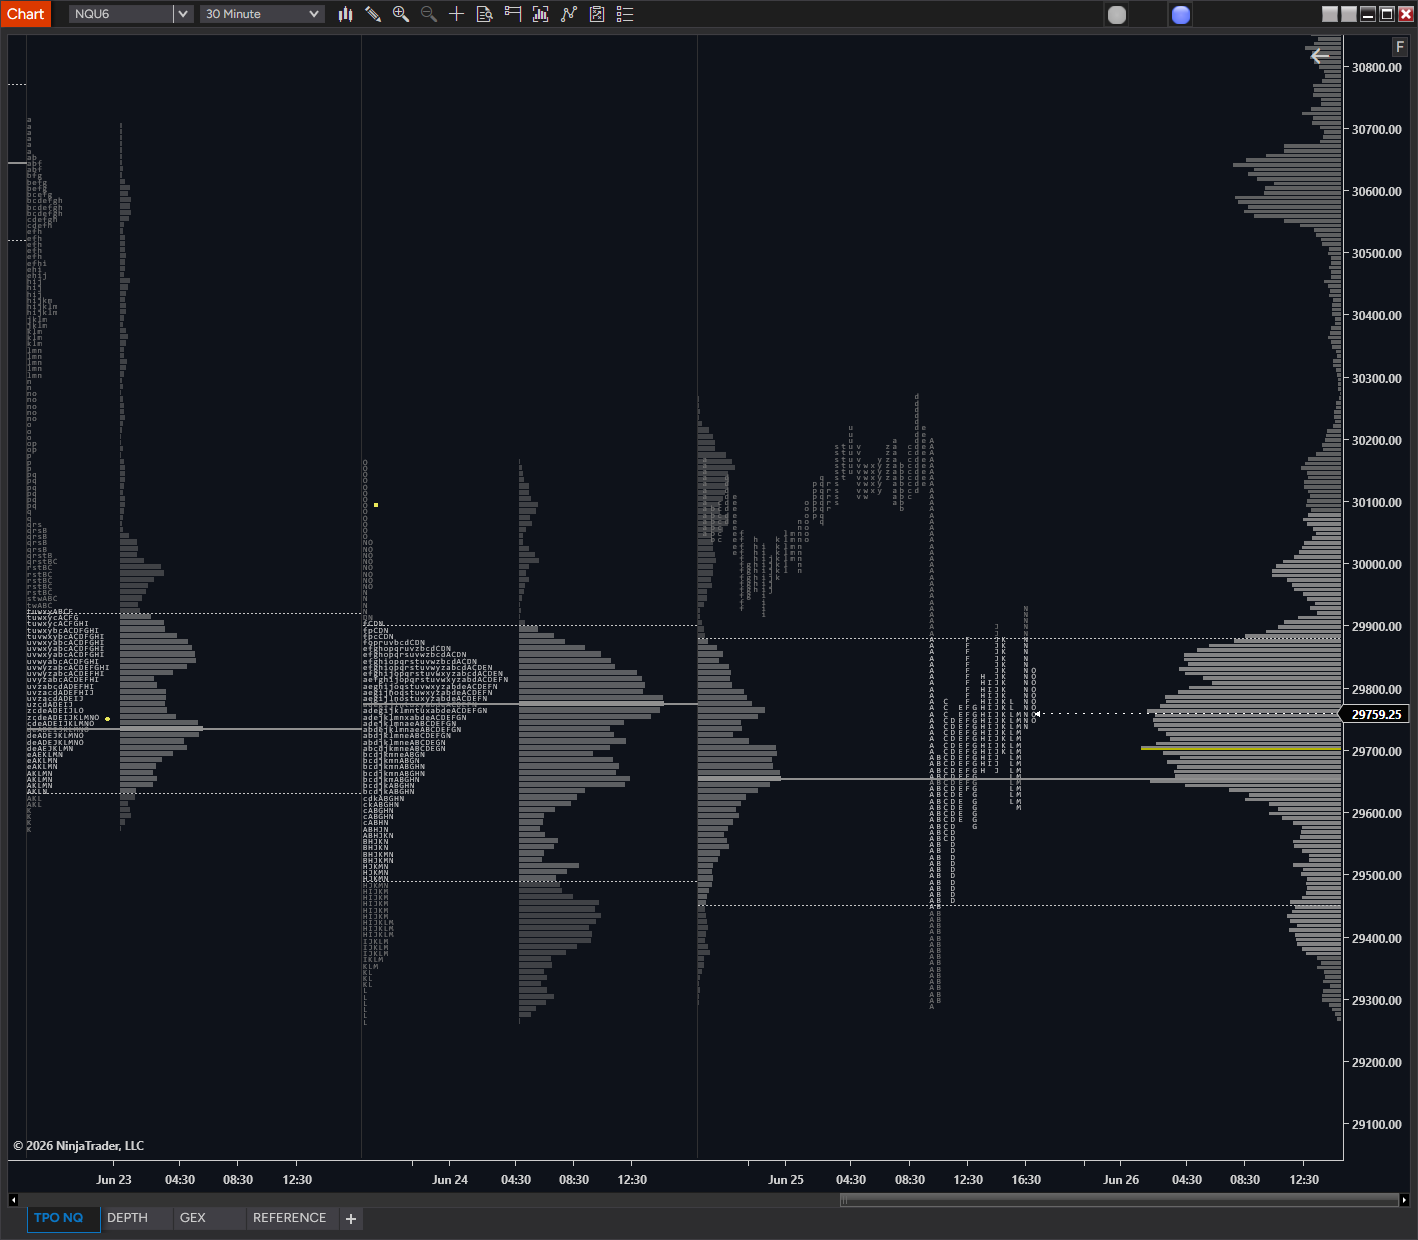
✦ Fully customizable — switch between multiple visual styles to find the look that fits your chart.

.png)
.png)
.png)
.png)